home : case study
Providence Healthcare / Accountability Matrix
Created a unified system wide assignment and governance tool for Providence’s financial ecosystem.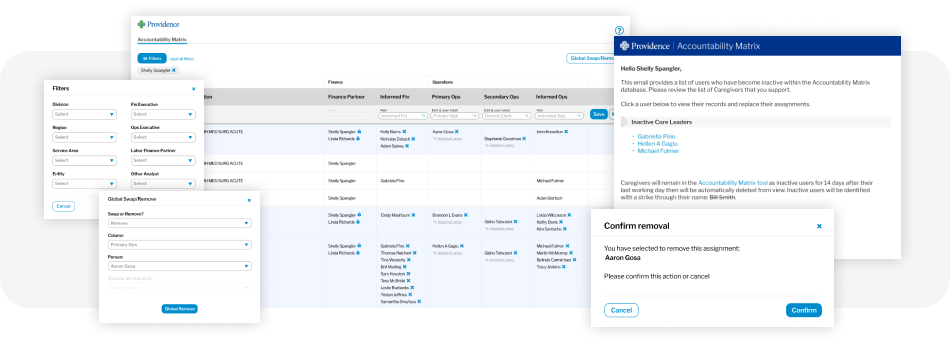
Overview
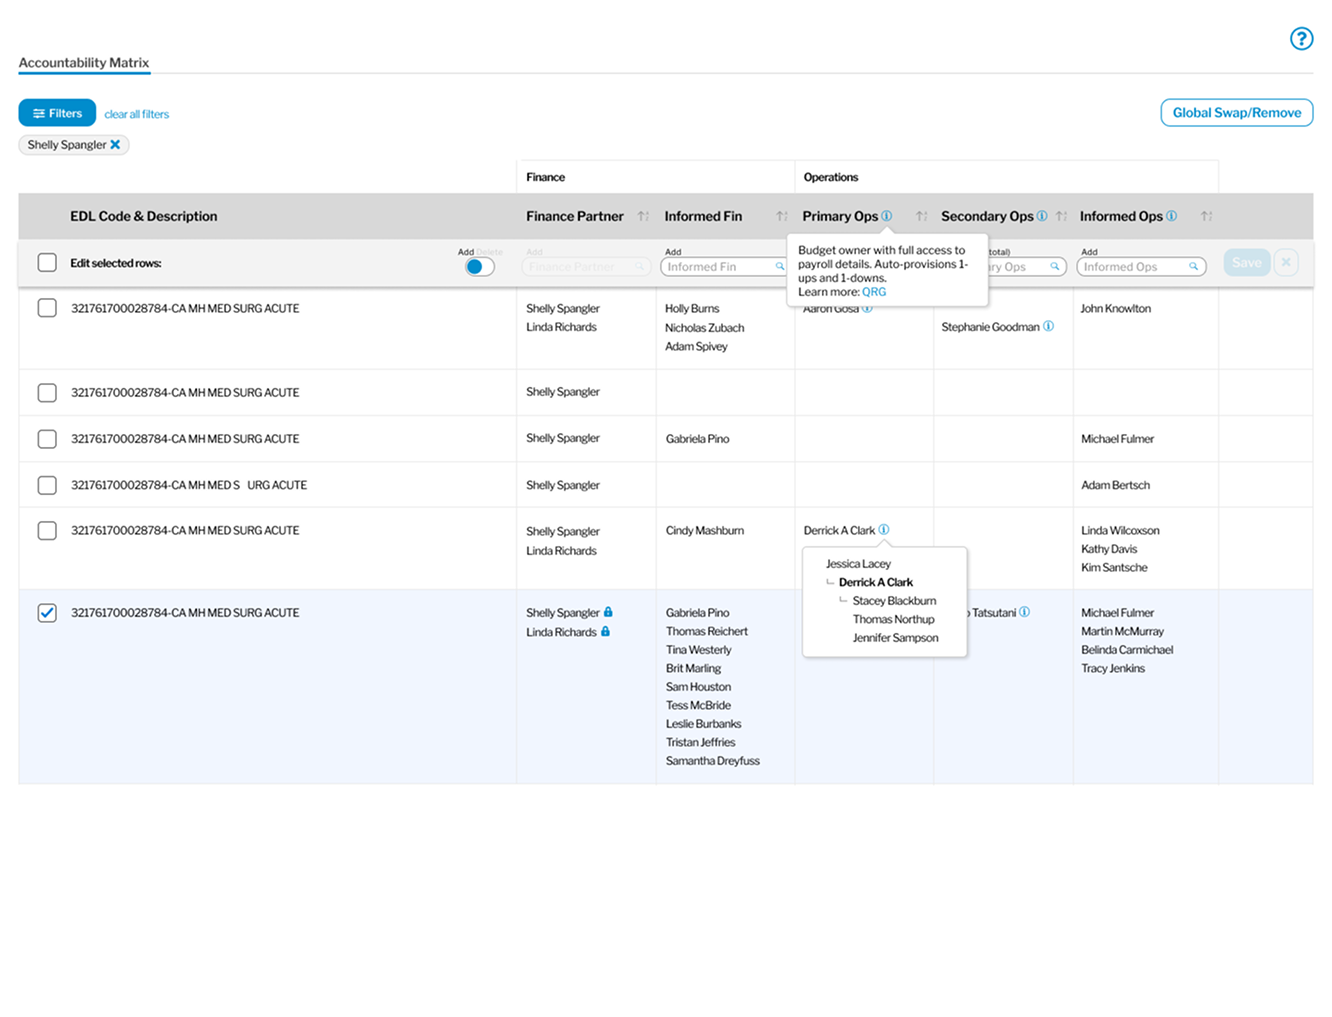
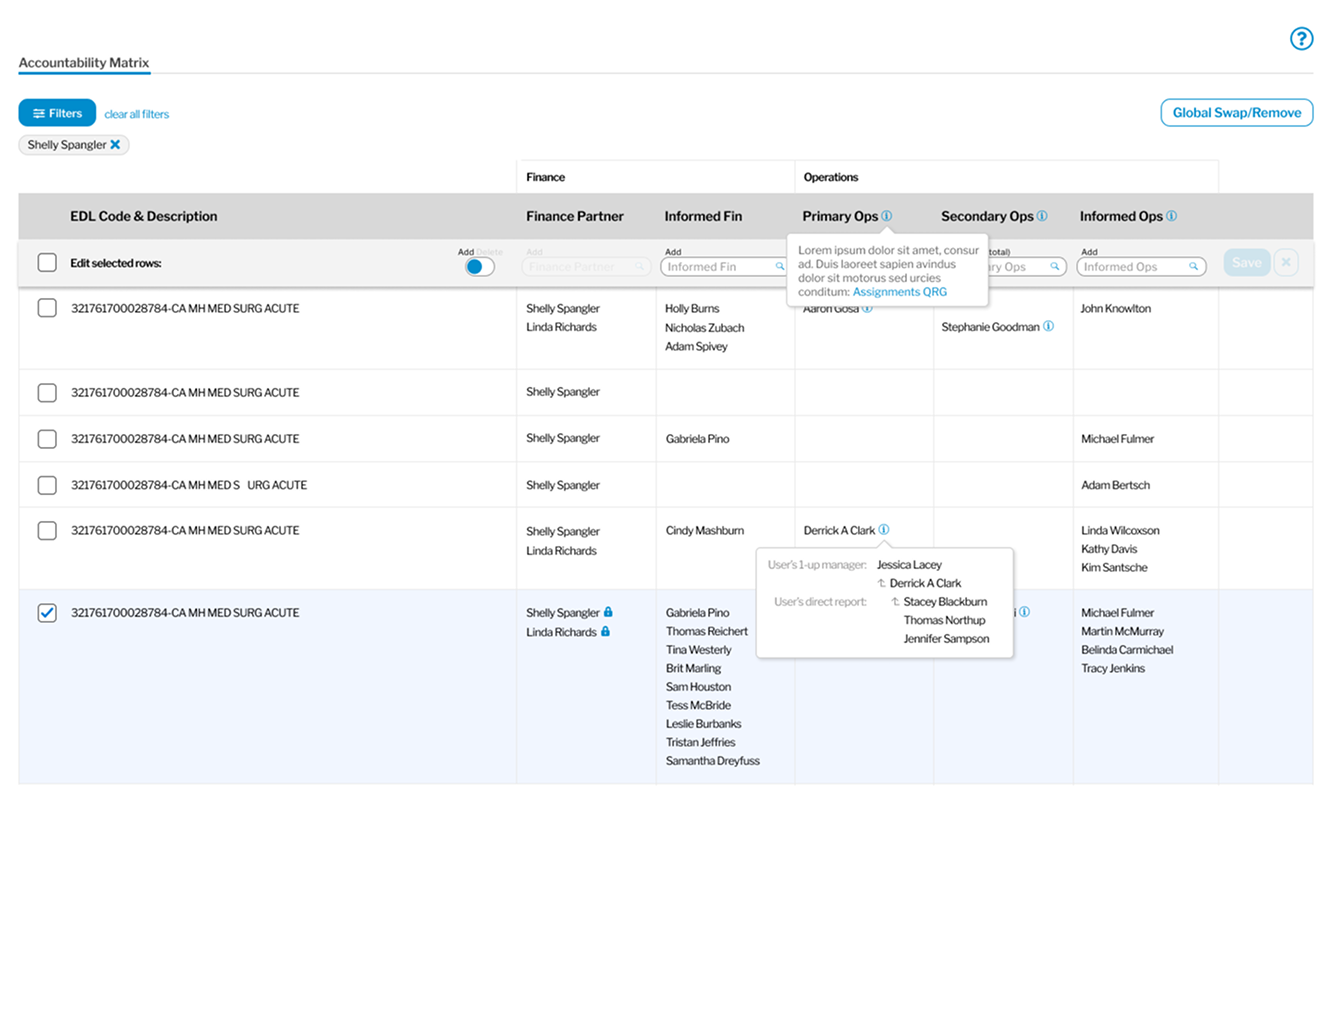
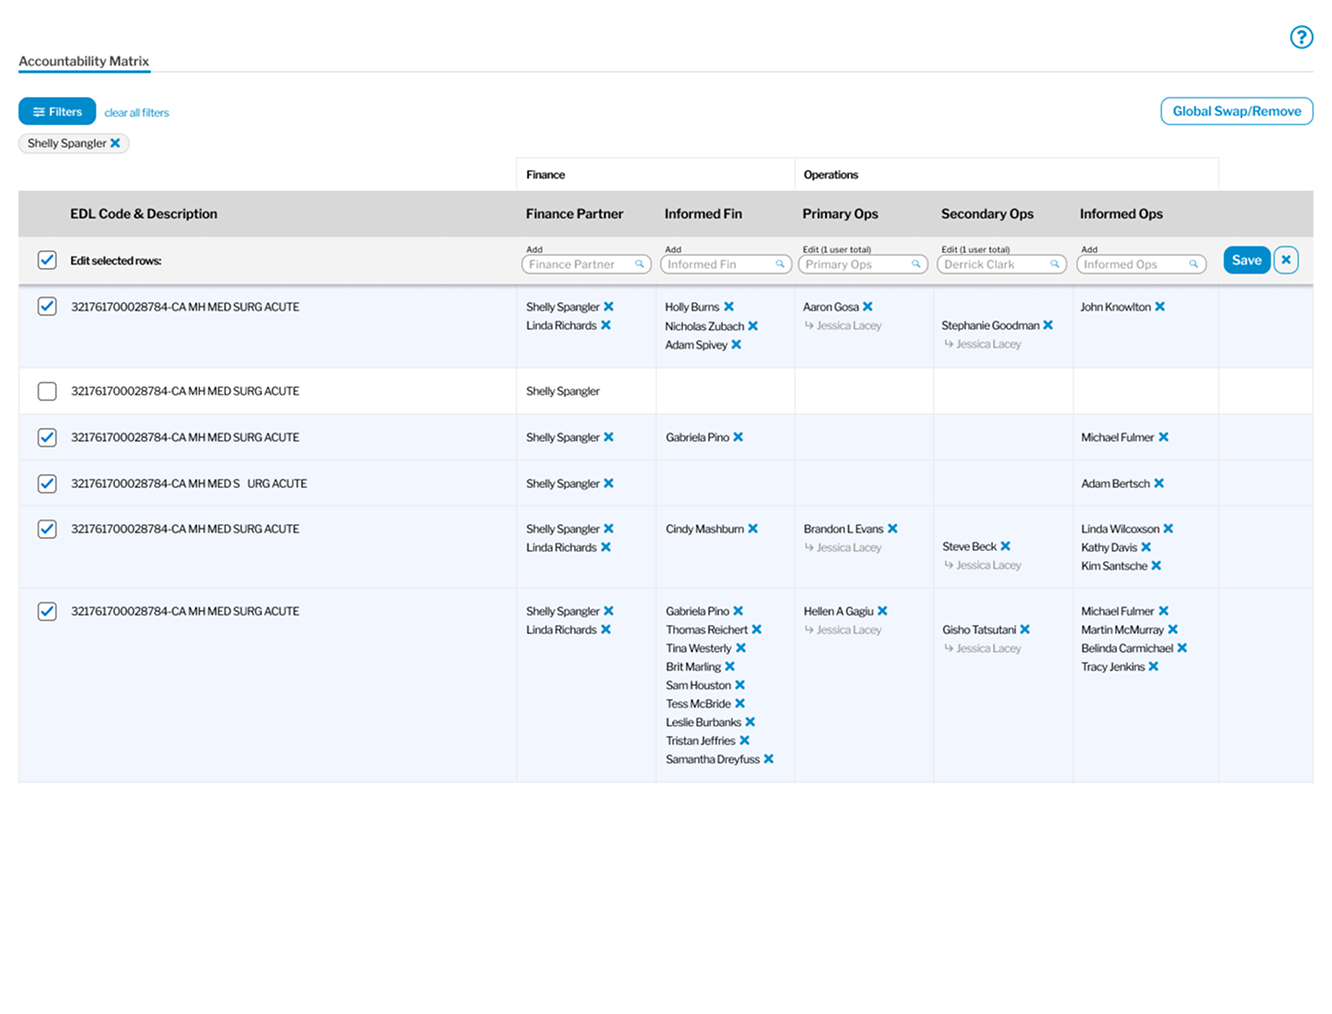
Providence Healthcare manages an enormous and complex financial ecosystem spanning thousands of departments, multiple regions, and a broad community of finance and operations users. Before this project, there was no standardized or reliable method for determining which financial caregivers were responsible for which departments resulting in fragmented spreadsheets, manual distribution lists, access inconsistencies, and gaps in critical reporting.I was brought in to design and build a new internal tool titled The Accountability Matrix using an existing BRD as the foundational reference. This tool provides a single system of record for assigning, maintaining, and governing caregiver responsibilities across Finance (Finance Partners, Informed Finance) and Operations (Primary Ops, Secondary Ops, and Informed Ops) roles.
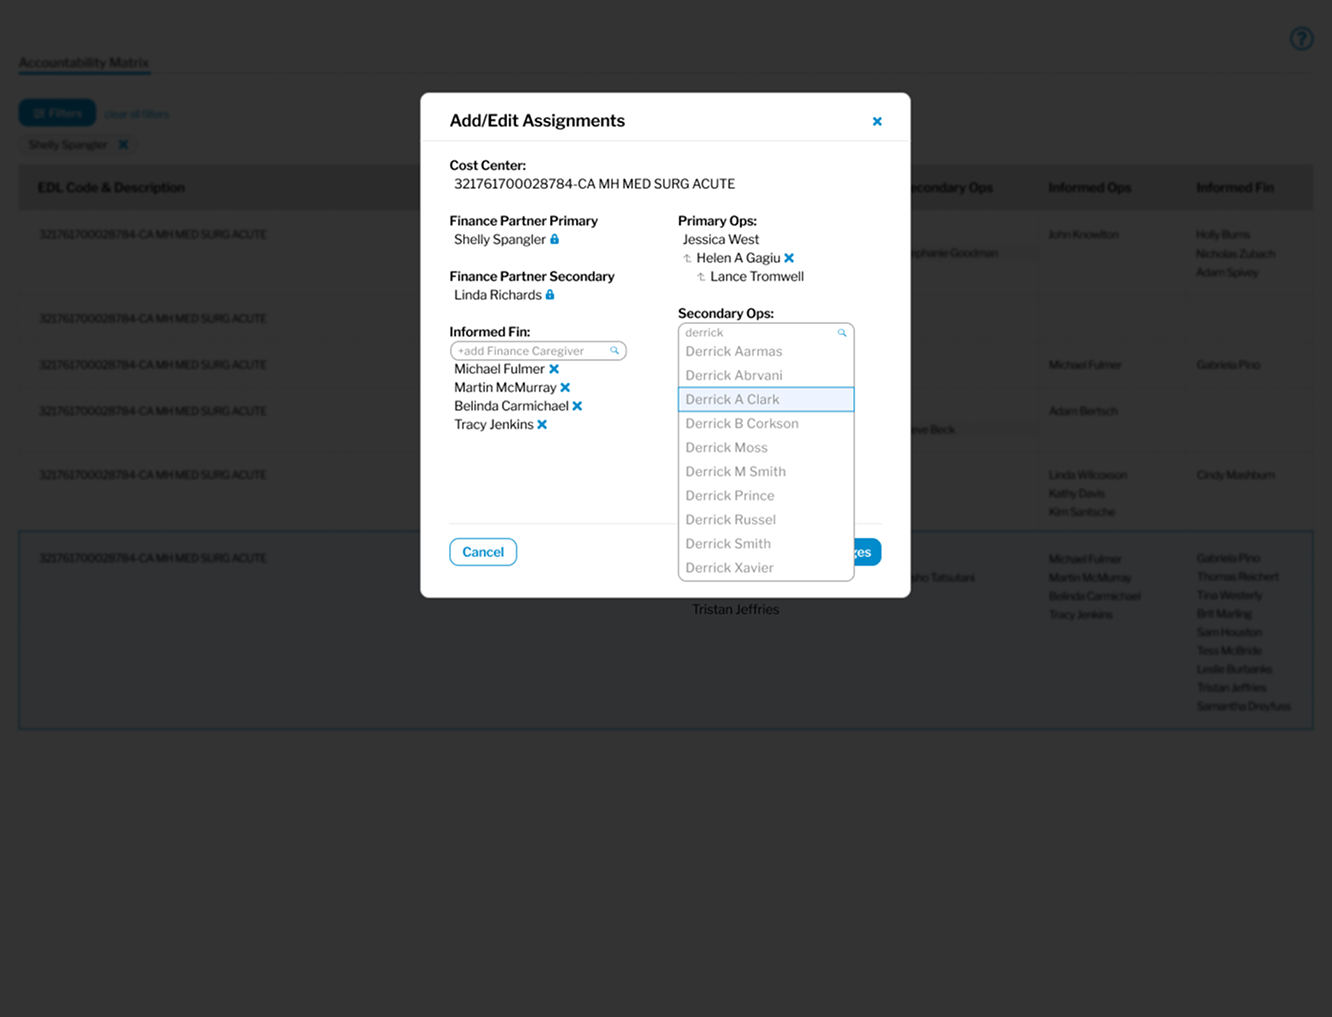
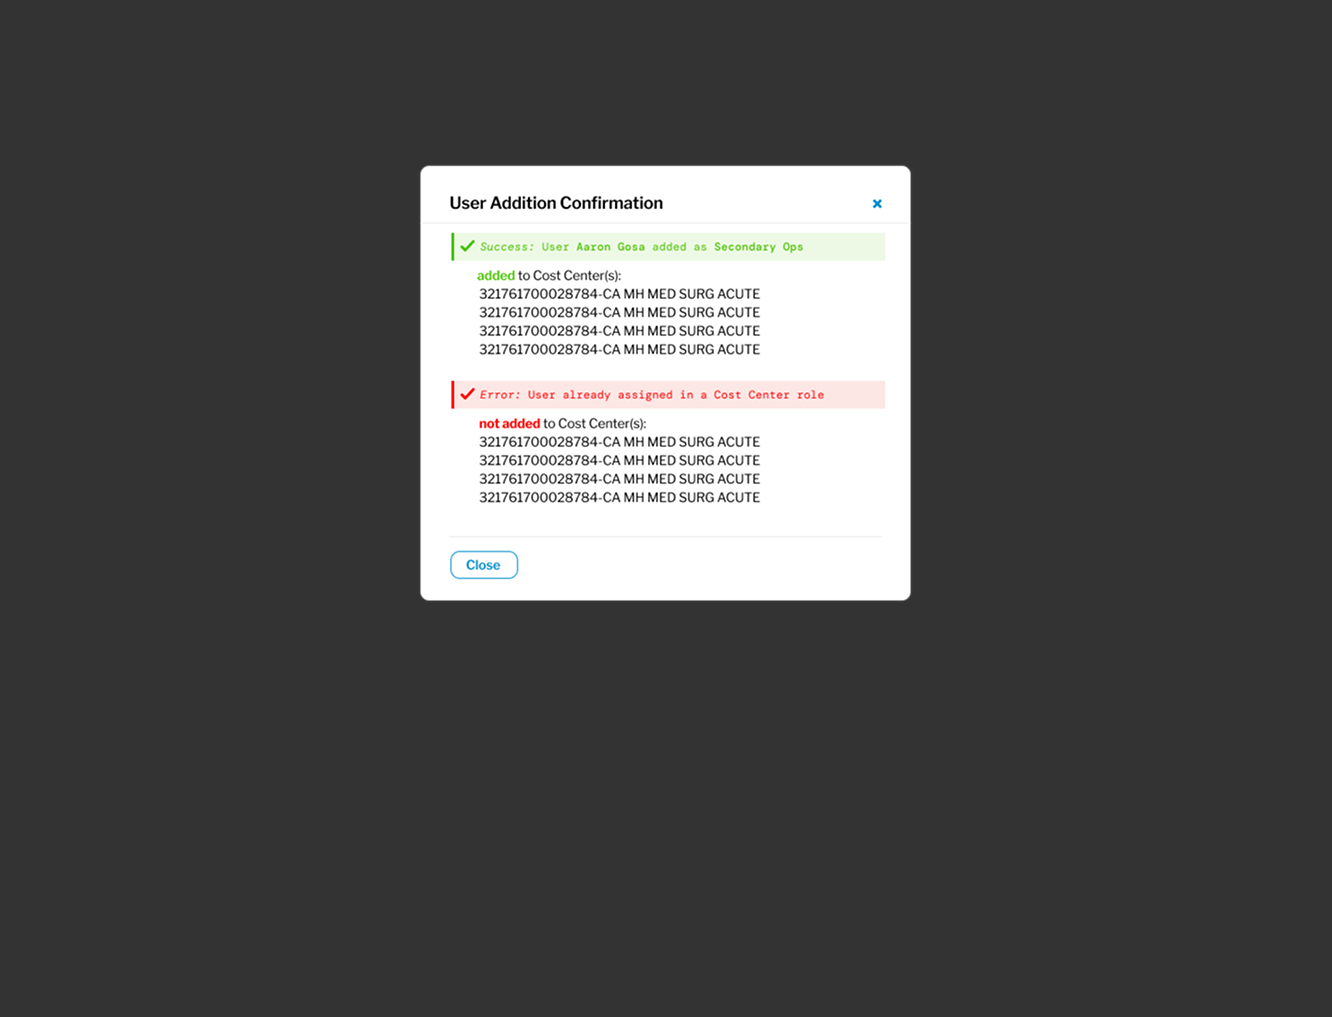
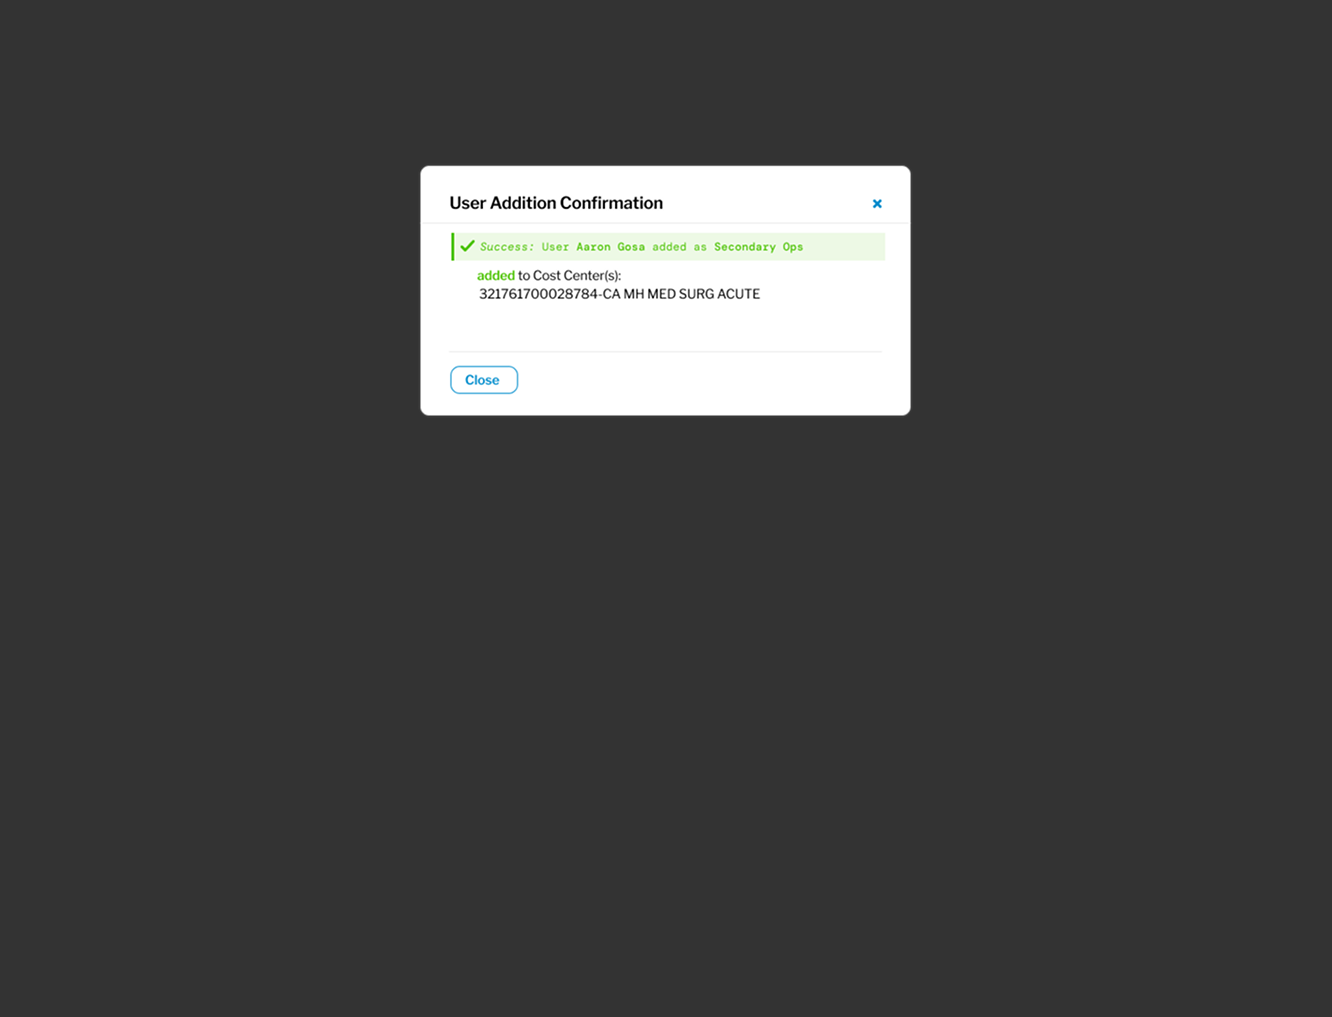
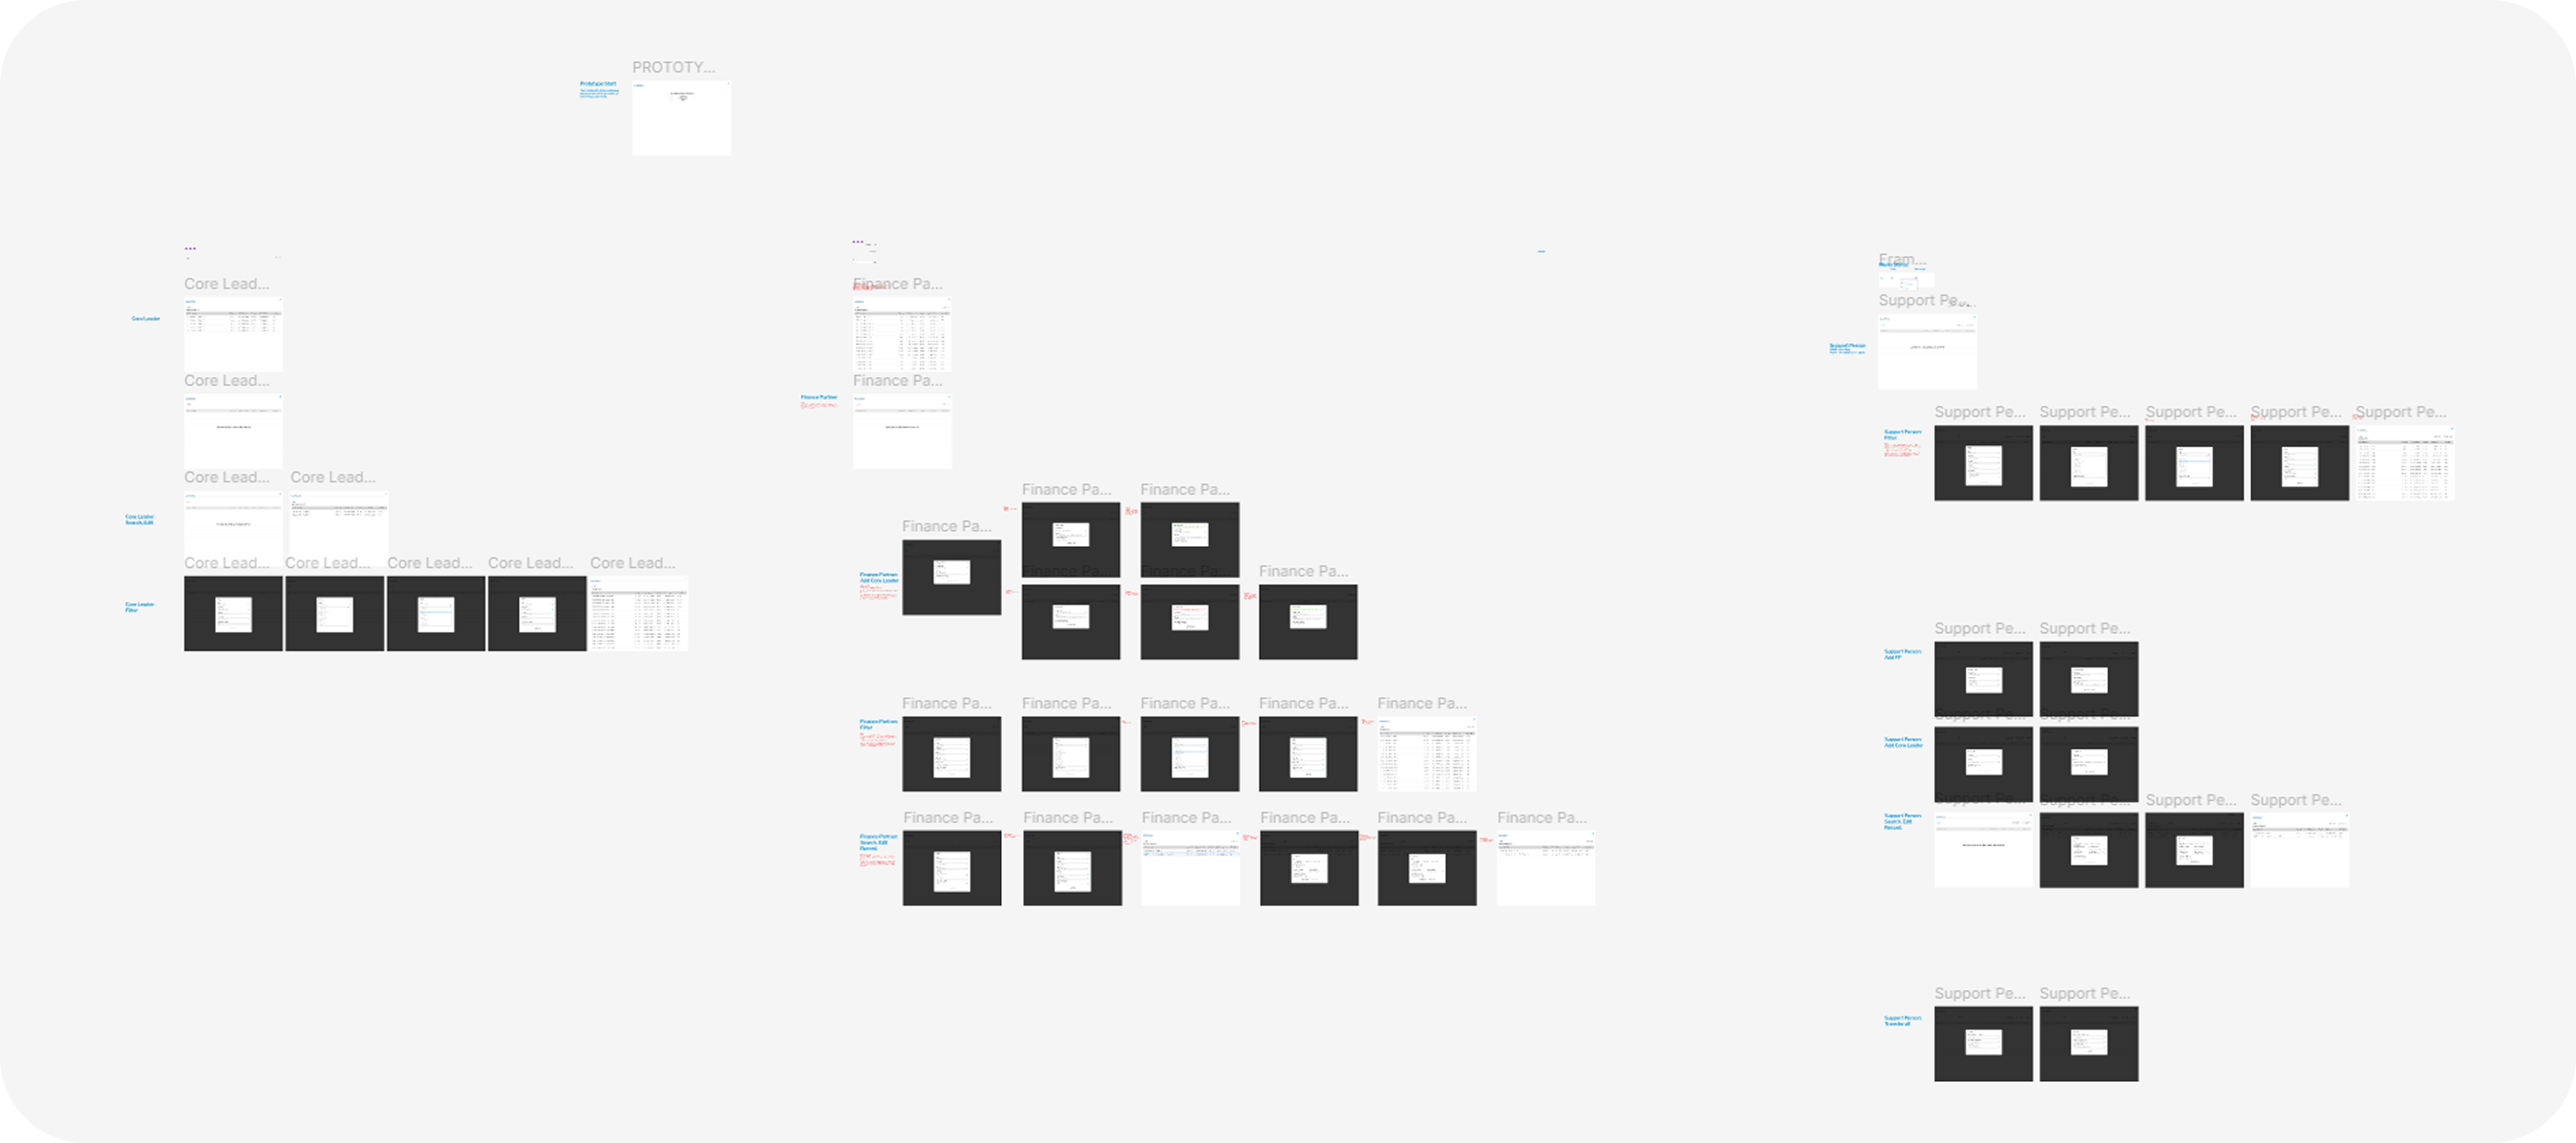
The Accountability Matrix centralizes assignment management, supports downstream data distribution (ValueLens, PowerBI, Tableau, etc.), and enables teams to accurately control reporting access and automate communications. I led the UX from wireframes to final Figma designs and collaborated with Providence stakeholders and an internal developer to bring the tool into production. Screenshots below show the tool’s evolution from initial data views to swap workflows to the editable grid interface.
My Approach
I began by deeply analyzing the Business Requirements Document which included the scope, current state challenges, intended end state, user types, and 40+ use cases. Discovery was completed before I joined so my initial role was to interpret and synthesize the existing requirements into a coherent UX architecture, build and prove wireframes, design a final UI, and bring the project over the finish line with a developer as a working useable tool within the Providence ecosystem.
Information Architecture & Wireframes
I created low-fidelity wireframes outlining key screens:
I created low-fidelity wireframes outlining key screens:
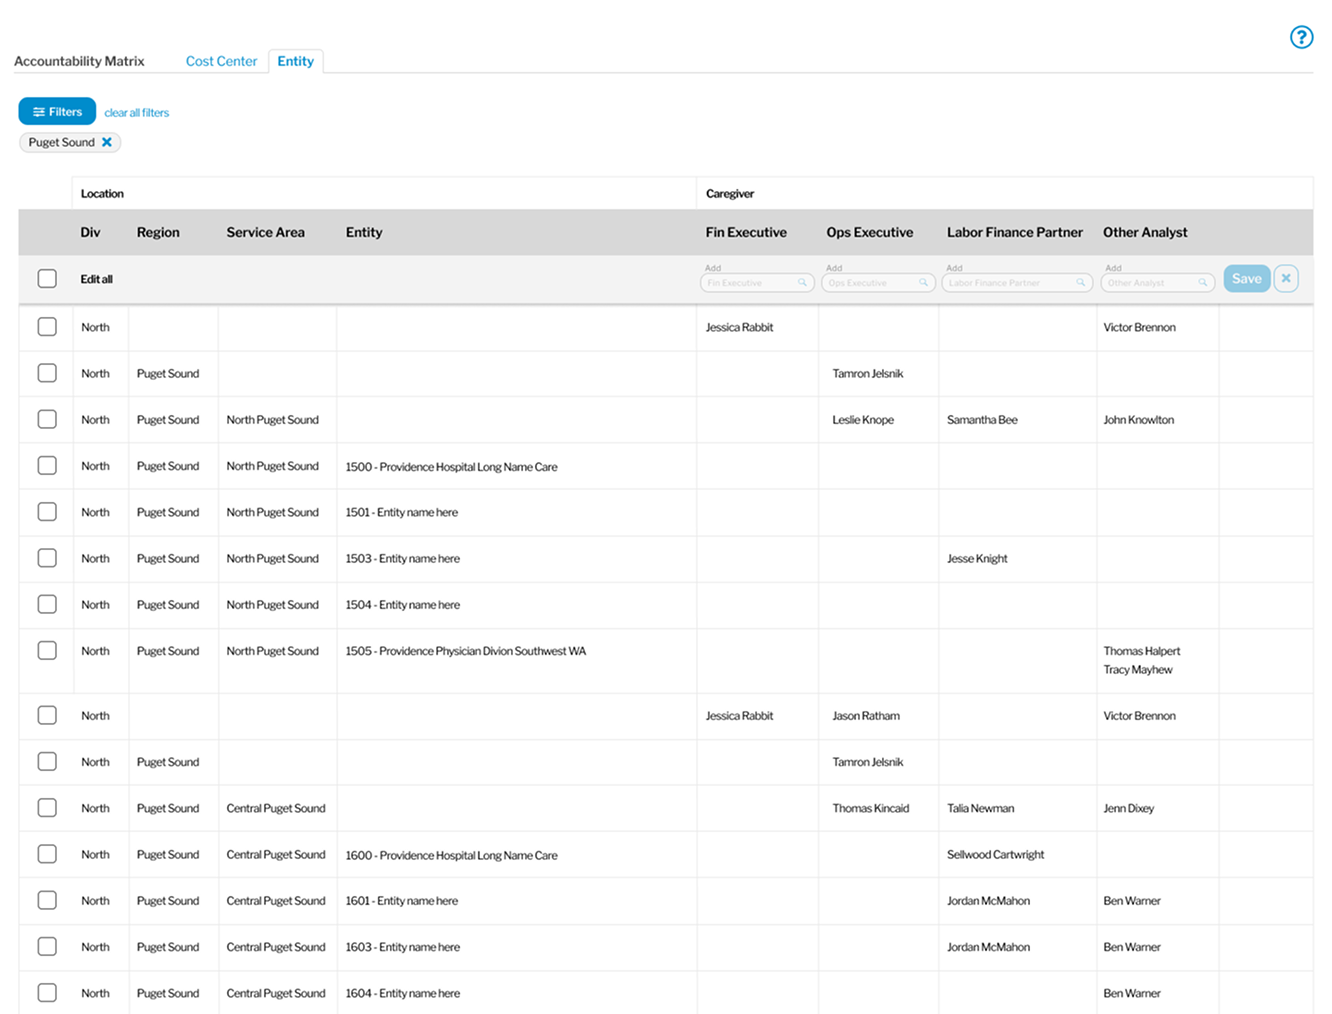
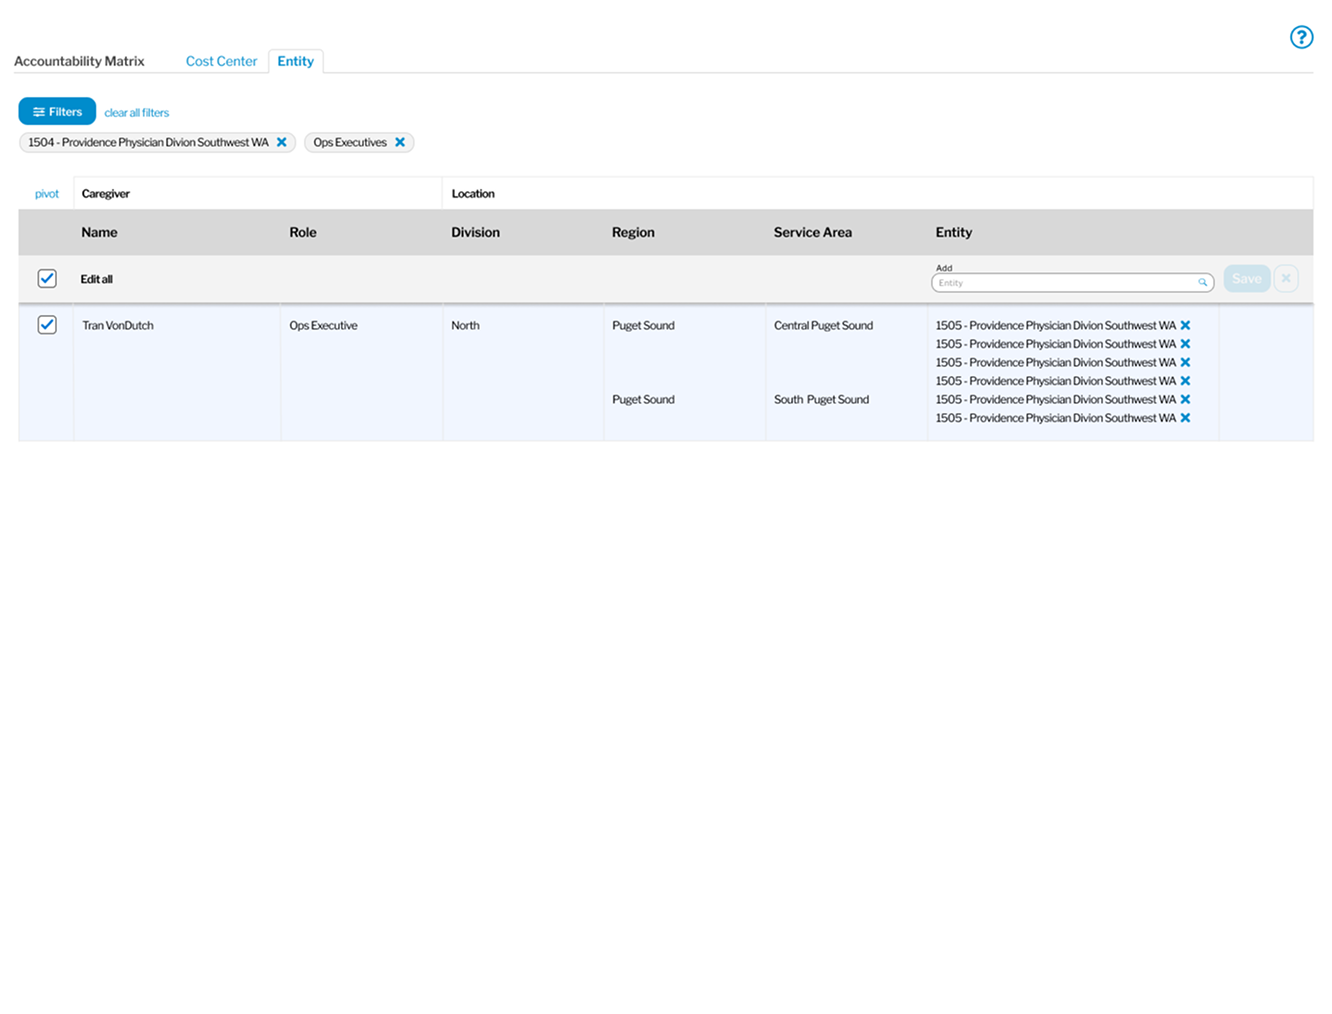
- Department-to-caregiver grid view
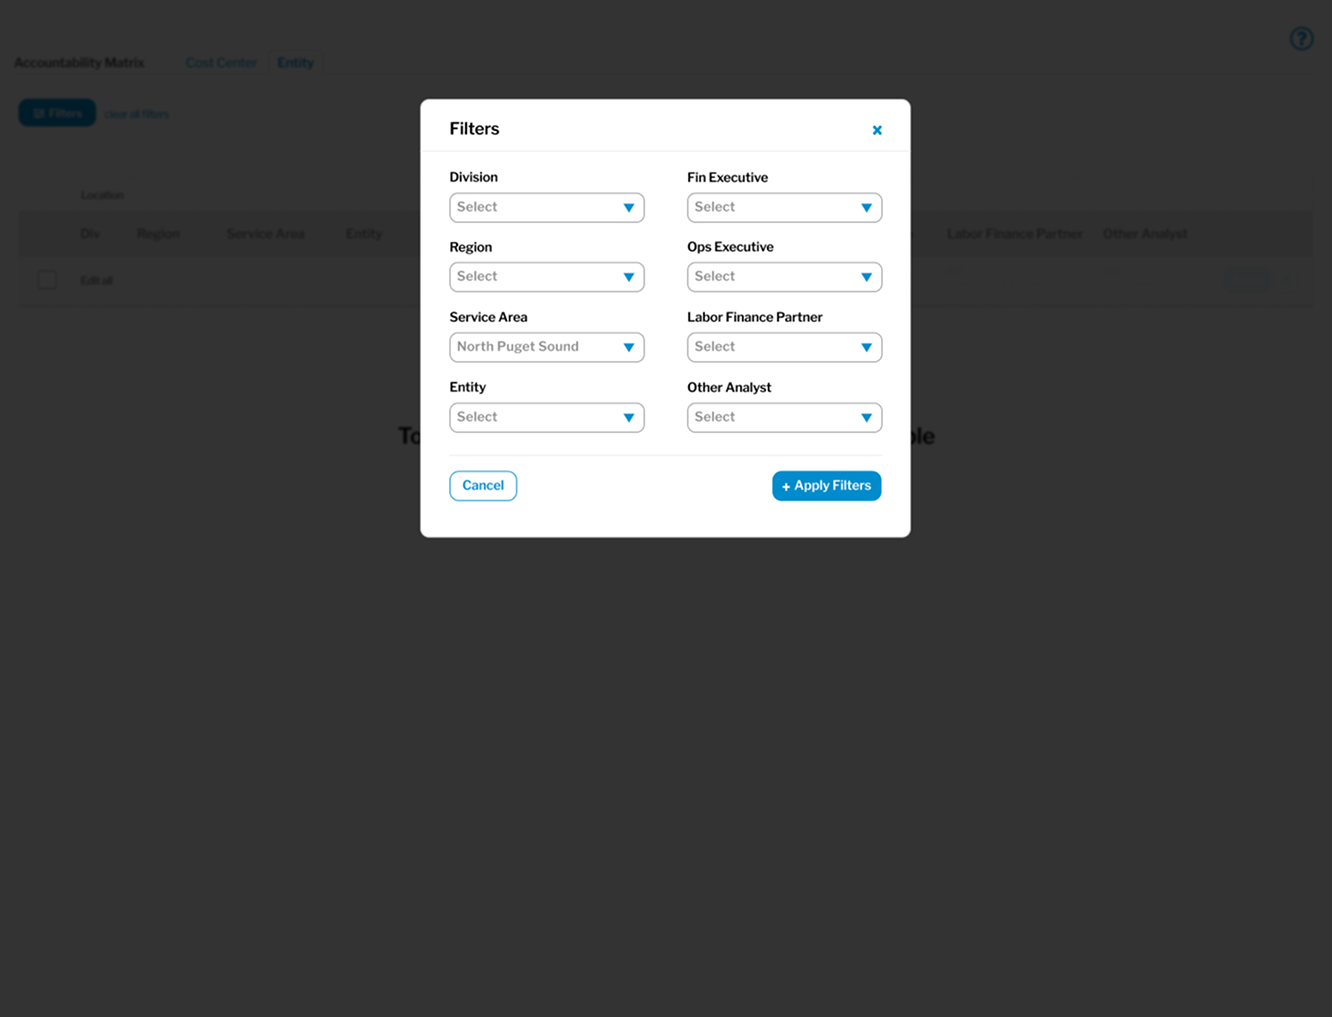
- User filters (region, state, hospital, department, role type)
- Search by department ID or Employee ID
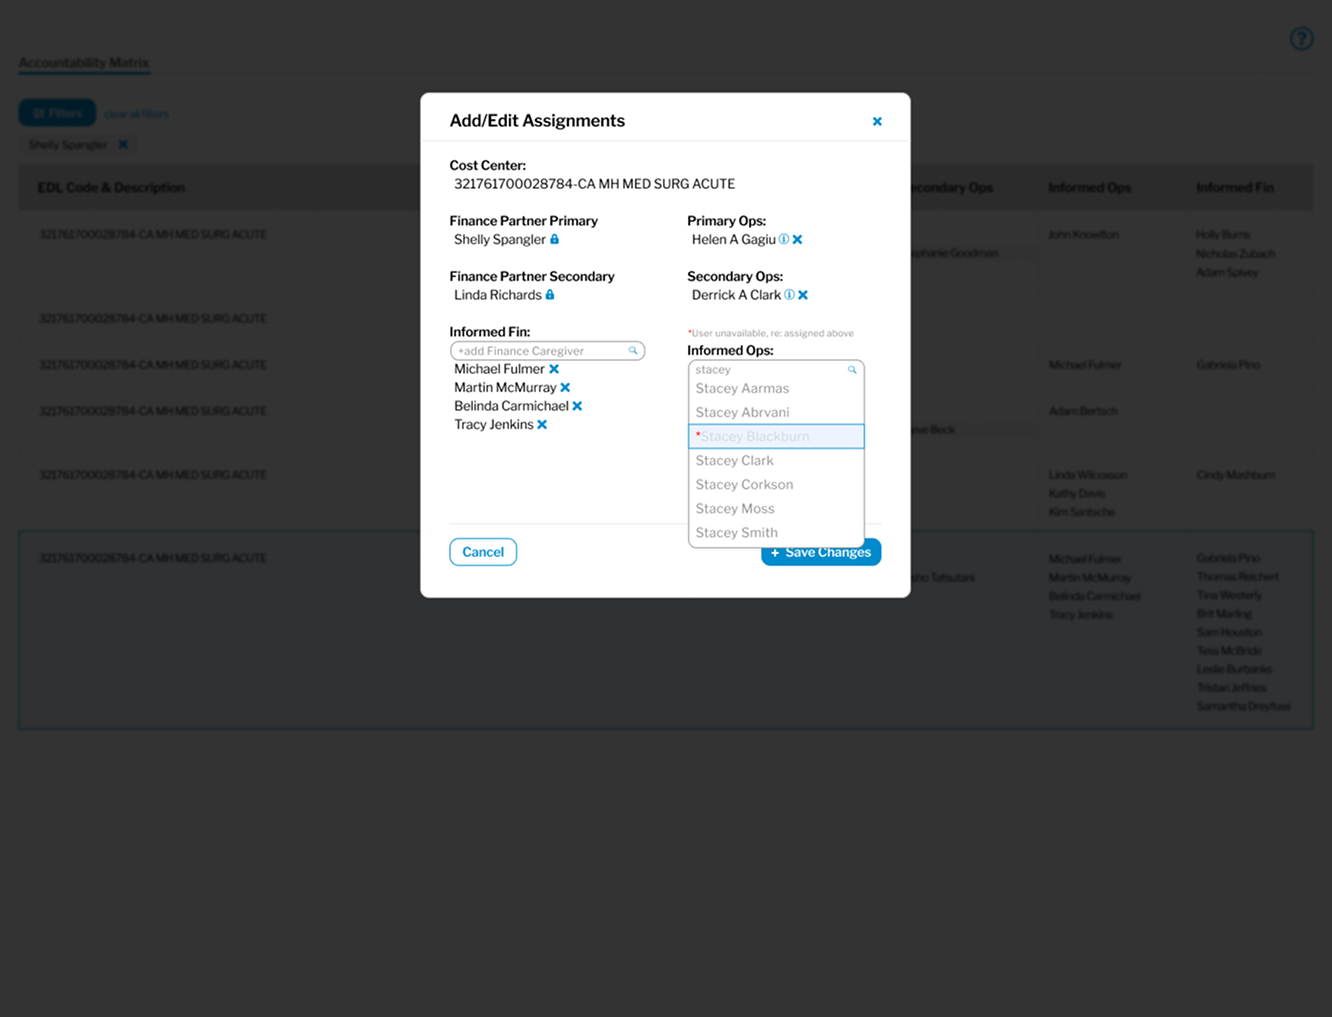
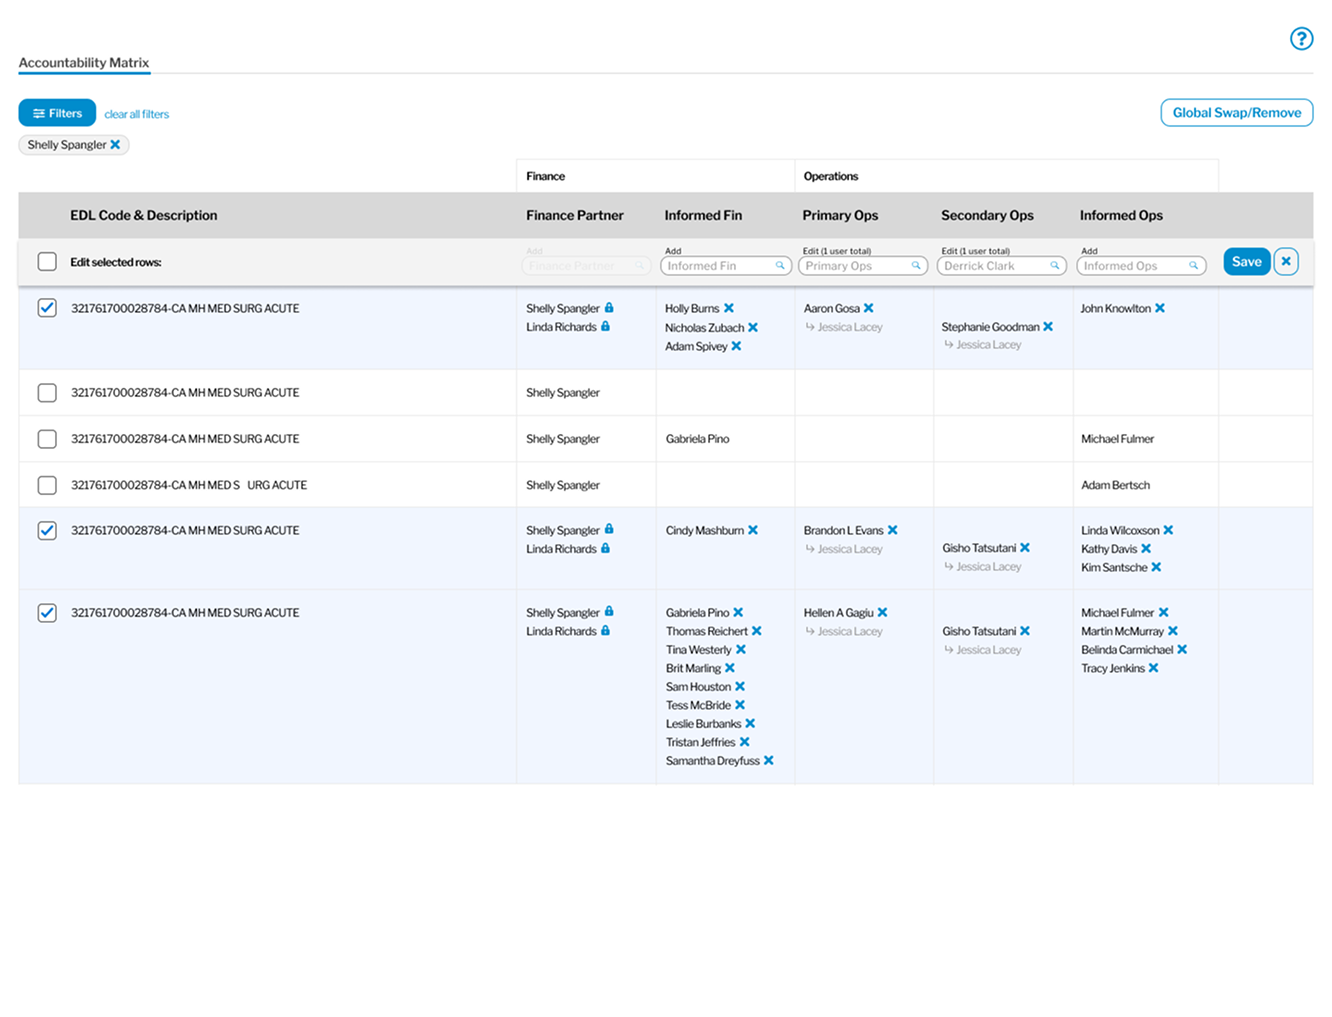
- Assignment edit modes
- Global swap/replace workflows
- Super-user upload and rollback workflows
Designing role specific workflows
The tool supports two primary user groups:
Finance Partners
- View departments they control
- See all assigned caregivers within each Ops/Finance role
- Add, remove, or replace individuals
- Sort and filter departments
- Perform full-responsibility swaps for departing or transitioning caregivers
Support Personnel (Super Users)
- Add or remove Finance Partners from the tool
- Migrate entire sets of responsibilities from one caregiver to another
- Upload spreadsheets to do large batch updates
- View change history by department or user
- Roll back erroneous changes
Designing in high fidelity
Once workflows were validated, I created high-fidelity Figma designs.